Table 1: Time required for prevalence rates of resistance to reach 25% in hospitals.
|
Drug |
Year Drug Introduced |
Years to report of resistance |
Years until 25% rate in hospitals |
Years until 25% rate in the community |
|
Penicillin |
1941 |
1-2 |
6 |
15-20 |
|
Vancomycin |
1956 |
40 |
? |
? |
|
Methicillin |
1961 |
<1 |
25-30 |
40-50 (projected) |
Chambers H. Emerging Infect Dis. 2001;7:179.
Figure 1: The sixth plaque of Egypt-the plague of boils (Exodus IV), 1483.
From the woodblocks of the Great Cologne Bible, 1483.
Figure 2: Increasing incidence of MRSA infection in the United States.
Figure 3: Chronologic evolution of resistant Staphylococcus aureus
Adapted from: CDC’s 12 Steps to prevent antimicrobial resistance in hospitals.
http://www.cdc.gov/drugresistance/healthcare/tools.htm#slides
Figure 4
Figure 5: Community-acquired MRSA skin infection in a patient after obtaining a tattoo.
MMWR. 55(24):677-9. 2006. June 23

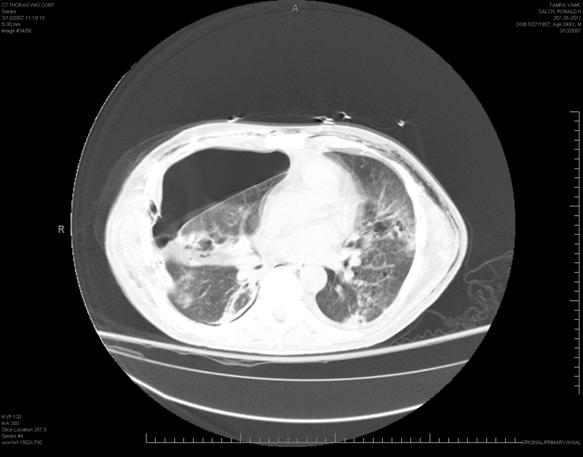
Figure 6: Nosocomial necrotizing MRSA pneumonia with spontaneous right pneumothorax in ICU
patient (Photo courtesy of the author)