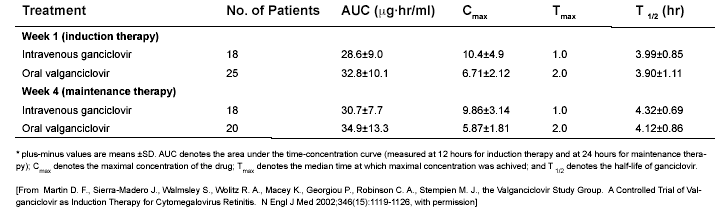
Table 1. Pharmacokinetic Values for Ganciclovir after Treatment with Intravenous Ganciclovir or Oral Valganciclovir.
Table 2. Dosing of Ganciclovir (Intravenous and Oral) and Valganciclovir (oral) in CMV Infection with Normal Renal Function as Indicated by the Food and Drug Administration.
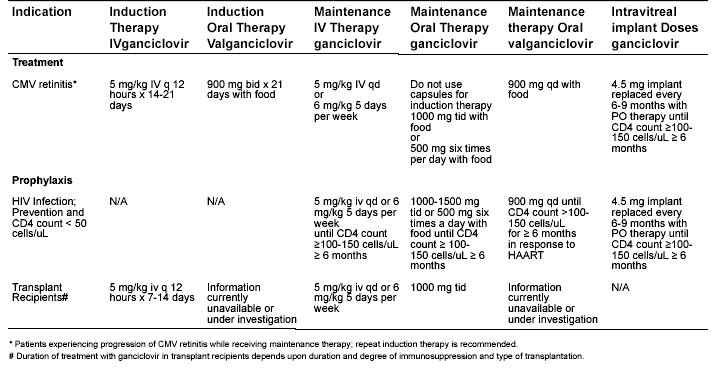
Table 3. Ganciclovir Dosing During Renal Impairment
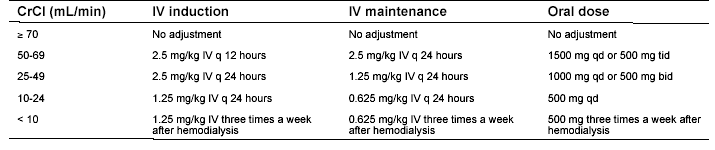
Table 4. Valganciclovir Dosing for Impaired Renal Function
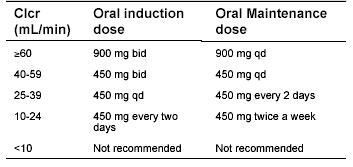
Figure 1. Chemical structures of the antiviral drugs acyclovir ganciclovir and valganciclovir. Adapted from Oliver S, Bubley G, and Crumpacker CS. Inhibition of HSV-transformed murine cells by nucleoside analogs, 2’NDG and 2’-nor-cGMP: mechanism of inhibition and reversal by exogenous nucleosides. Virology 1985; 145: 84-93, with permission from Elsevier and reference (100).
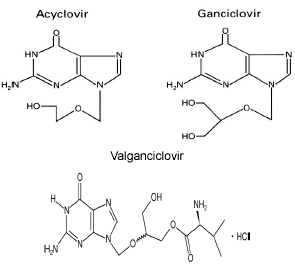
Figure 2. Intracellular phosphorylation of ganciclovir by clinical isolates. Infected and uninfected MRC-5 cells, a human embryonic lung-cell line, were pulse-labeled on day 3 with 12.5 mg of [14C] ganciclovir per milliliter for the times indicated, and phosphorylation was measured by cation-exchange chromatography. Patient isolates C8801 and C8702 were resistant to ganciclovir in vitro. An early-therapy isolate (C8708) was susceptible to ganciclovir, and a late isolate (C8704) from the same patient was resistant. 759D100-1 is a ganciclovir –resistant mutant of AD169. [Reprinted from Stanat SC, Reardon, JE, Erice A, et al. Ganciclovir-resistant cytomegalovirus clinical isolates: mode of resistance to ganciclovir. Antimicrob Agents Chemother 1991; 35: 2191-2197, with permission (90)] .
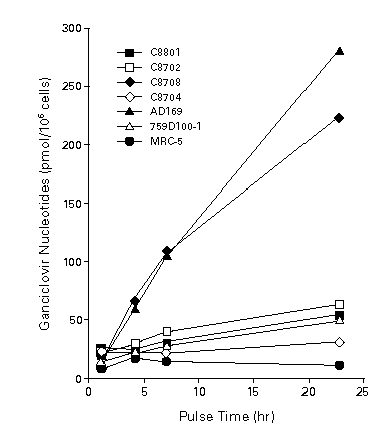
Figure 3. Pharmacokinetics of oral and intravenous ganciclovir in normal subjects. The same 16 subjects were included in all studies. Cmax denotes the maximal concentration after a dose, Cmin the minimal concentration after a dose, AUC the area under the curve for serum concentration plotted against time, and IC50 the concentration of drug that inhibits 50% of CMV in a plaque-reduction assay. [From Anderson RD, Griffy KG, Jung D, et al. Ganciclovir absolute bioavailability and steady-state pharmacokinetics after oral administration of two 3000 mg/day dosing regimens in human immunodeficiency virus and cytomegalovirus-seropositive patients. Clin Ther 1995; 17: 425-432, with permission (2)]
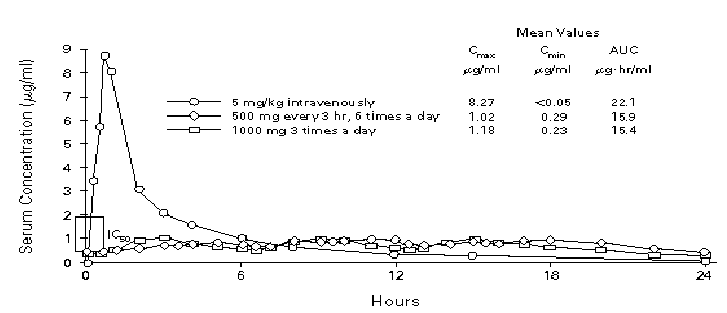
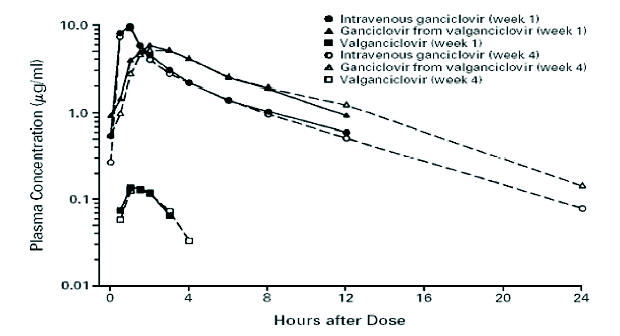
Figure 4. Mean Steady-State Ganciclovir and Valganciclovir Concentrations after Treatment with Intravenous Ganciclovir or Oral Valganciclovir. The scale for plasma concentrations is logarithmic. Week 1 denotes induction therapy, and week 4 maintenance therapy. [From Martin D. F., Sierra-Madero J., Walmsley S., Wolitz R. A., Macey K., Georgiou P., Robinson C. A., Stempien M. J., the Valganciclovir Study Group. A Controlled Trial of Valganciclovir as Induction Therapy for Cytomegalovirus Retinitis. N Engl J Med 2002;346(15):1119-1126, with permission (64)].