Table 1. Rifampin Activity Against Mycobacteria (79)
|
Organism |
# isolates |
MIC50 mg/ml |
MIC90 mg/ml |
Range or MIC (unspecified) mg/ml |
|
|
|
|
|
|
|
Mycobacteria
|
|
|
|
|
|
Mycobacterium abscessus
|
1 |
|
|
>20 |
|
Mycobacterium acapulcensis
|
1 |
|
|
2.5 |
|
Mycobacterium asiaticum
|
10 |
|
|
>1 |
|
Mycobacterium aurum
|
1 |
|
|
10 |
|
Mycobacterium avium-intracellulare complex
|
35 52 523 16
|
<0.12 6.25 10 2.0 |
2 50
8.0 |
<0.12-4 0.78->100
0.25-16 |
|
Mycobacterium borstelense
|
1 |
|
|
>20 |
|
Mycobacterium bovis
|
38 |
|
1 |
|
|
Mycobacterium bovis-BCG
|
22 |
|
1 |
|
|
Mycobacterium celatum
|
2 |
|
|
128-256 |
|
Mycobacterium chelonae
|
15 60 16 |
>64
64
|
>64 >5 |
>64
0.25->256 |
|
Mycobacterium chelonae subsp. abscessus
|
1 20 |
>100 |
>100
|
50 50->100 |
|
Mycobacterium chelonae subsp. chelonae
|
20 |
>100 |
>100 |
25->100 |
|
Mycobacterium chelonae-fortuitum
|
5 |
>16 |
|
0.25->16 |
|
Mycobacterium chitae
|
2 |
|
|
10-20 |
|
Mycobacterium diernhoferi
|
1 |
|
|
20 |
|
Mycobacterium fallax
|
10 |
<0.25 |
4 |
<0.25-16 |
|
Mycobacterium flavescens
|
1 15 |
|
|
25 >1
|
|
Mycobacterium fortuitum
|
18 17 10 30 9 28 20 |
>64 5
>10 >8 64 50
|
>64 >20
100 |
16->64
>16
>8 0.125->256 12.5-100 |
|
Mycobacterium gastri
|
4 |
1 |
|
|
|
Mycobacterium gordonae
|
32 141 |
1 |
1a |
1a
|
|
Mycobacterium haemophilum
|
17 3 |
0.5 |
1.0 |
0.5-2.0 0.25-1
|
|
Mycobacterium intracellulare |
20 |
0.5 |
2 |
|
|
Mycobacterium kansasii
|
6 10 13 32 8 1 10 19 71
|
1.25 <0.25
1
0.25 0.2 1.0 |
1.25 0.5 1a
3.13 |
0.1-0.5
1a
1 0.125-0.5 0.025-3.13 |
|
Mycobacterium leprae
|
N/A |
|
|
(<1) |
|
Mycobacterium malmoense
|
1 47 |
1
|
|
1 |
|
Mycobacterium marinum
|
17 12 10 1 28 10 11 5 10 33
|
0.5
0.25 0.2
|
1 1a
0.39 1.0a |
1a 0.4-1.6 1.25 (1) (1.56) 1.25-2.5 0.25-0.5 0.1-0.39 1.0a |
|
Mycobacterium microti
|
1 |
|
|
0.0025-0.040 |
|
Mycobacterium parafortuitum
|
1 1 |
|
|
10 50
|
|
Mycobacterium phlei |
12 1 |
|
<0.32 |
0.6 |
|
Mycobacterium runyonii
|
1 |
|
|
>20 |
|
Mycobacterium scrofulaceum |
19 19 51
|
1.56 0.78
|
12.5 6.25 |
0.1-6.25 >1 |
|
Mycobacterium simiae
|
3 2 28
|
|
>10a |
>10a >25 (>1)
|
|
Mycobacterium smegmatis
|
1 27 2 |
>16 |
>16 |
17 4->16 50
|
|
Mycobacterium szulgai
|
23 9 1
|
1 |
5.0a 1.0a |
5.0 a 1.0 a |
|
Mycobacterium terrae
|
7 64
|
|
5 |
1-5 >1 |
|
Mycobacterium thermoresistibile
|
1 1 1 |
|
|
1 1 1 |
|
Mycobacterium trivale
|
2 |
|
1a |
1a |
|
Mycobacterium tuberculosis rifampicin-sensitive
|
16 |
0.1 |
0.2 |
0.025-0.2 |
|
Mycobacterium tuberculosis rifampicin-resistant
|
6 |
100 |
100 |
50-100 |
|
Mycobacterium ulcerans
|
N/A |
|
|
(0.005-0.2) |
|
Mycobacterium vaccae
|
1 1 |
|
|
2.5 6.25
|
|
Mycobacterium xenopi
|
3 34 1 25 40 7 |
1
|
1a
1 |
1a
<1u ,1.5v
0.5-2 1
|
Table 2. Rifabutin Activity Against Mycobacteria (79)
|
Organism |
# isolates |
MIC50 mg/ml |
MIC90 mg/ml |
Range or MIC (unspecified) mg/ml |
|
Mycobacteria
|
|
|
|
|
|
Mycobacterium avium complex
|
52 523 21 16
|
0.39
0.5 0.5 |
1.56 2.0 2 1.0 |
0.025-100
0.25-64 0.063-2.0 |
|
Mycobacterium bovis
|
N/A |
|
|
(<2) |
|
Mycobacterium celatum
|
2 2
|
|
|
0.5 8 |
|
Mycobacterium chelonae
|
18 N/A N/A 60
|
32 |
64
(>2.0) |
2-64 (32) (>5)
|
|
Mycobacterium chelonae subsp. abscessus
|
20 |
12.5 |
25
|
3.13-25
|
|
Mycobacterium chelonae subsp. chelonae
|
20 |
12.5 |
50 |
3.13-50 |
|
Mycobacterium fallax
|
10 N/A |
<0.25 |
1 |
<0.25--1 (<2) |
|
Mycobacterium flavescens |
N/A |
|
|
(>5) |
|
Mycobacterium fortuitum
|
17 28 N/A 20 30
|
1.25 1
3.13 >2.0 |
2.5 8
6.25
|
<0.25-8 (>5) 1.56-6.25
|
|
Mycobacterium gastri
|
N/A |
|
|
(<1) |
|
Mycobacterium gordonae
|
32 N/A |
|
0.5a |
0.5a (<1) |
|
Mycobacterium haemophilum
|
17 3
|
<0.03 |
<0.03 |
<0.03-0.06 0.25-1 |
|
Mycobacterium intracellulare
|
20 |
0.25 |
1 |
|
|
Mycobacterium kansasiii
|
10 13 21 32 19 |
0.075 <0.25
0.025 |
0.075 <0.25
0.1 |
0.25a 0.5a <0.0125-0.2 |
|
Mycobacterium malmoense
|
1 |
|
|
0.12 |
|
Mycobaacterium marinum
|
17 12 N/A 10 |
<0.25
0.1
|
<0.25
0.1 |
0.5a (<1) 0.025-0.2 |
|
Mycobacterium microti
|
N/A 1 |
|
|
(<2) 0.0015-0.026 |
|
Mycobacterium paratuberculosis
|
8 |
0.06 |
|
0.03-0.25 |
|
Mycobacterium phlei
|
N/A |
|
|
(<2) |
|
Mycobacterium scrofulaceum
|
N/A N/A 19 |
0.2
|
1.56 |
(<2) (<1) 0.025-100 |
|
Mycobacterium simiae
|
3 N/A 1 1
|
|
|
>2a (>5) 0.5 8 |
|
Mycobacterium smegmatis
|
27 |
4 |
8 |
1-8 |
|
Mycobacterium szulgai |
N/A |
|
|
(>5) |
|
Mycobacterium terrae
|
7 N/A |
|
1.0a |
(0.5b) (<1) |
|
Mycobacterium thermoresistibile
|
1 1 |
|
|
2.0 0.5 |
|
Mycobacterium triviale |
N/A |
|
|
(<1) |
|
Mycobacterium tuberculosis rifampicin-sensitive
|
16 180 |
0.025
|
0.5 |
0.025-0.05 0.5a |
|
Mycobacterium tuberculosis rifampicin-resistant
|
6 122 |
12.5 2.0 |
12.5 |
6.25-12.5 |
|
Mycobacterium ulcerans
|
N/A |
|
|
(<2) |
|
Mycobacterium xenopi
|
3 N/A 40 1 1 |
|
0.5 |
0.5a (<1) 0.5-2 0.5 0.1d ,0.25e |
Table 3. Pharmacologic and Pharmacodynamic Characteristics of the Three Currently Available Rifamycin Antibiotics (18)
|
Feature |
Rifampin 600 mg (twice weekly) |
Rifabutin 300 mg (twice weekly) |
Rifapentine 600 mg (once weekly) |
|
Bioavailability (%) |
68 |
20 |
Unknown |
|
Range of Tmax (time to Cmax; hr) |
1.5-2.0 |
2.5-4.0 |
5-6 |
|
Range of Cmax (mcg/ml) |
8-24 |
0.2-0.6 |
8-30 |
|
Effect of food |
Decrease AUC 6% Decrease Cmax 36% |
AUC & Cmax unchanged; Tmax increased |
Increase AUC 40-50% |
|
Effect of antacids |
None |
None (didanosine) |
Unknown |
|
Major metabolic pathway |
Deacetylation, hydrolysis to formyl derivatives |
CYP3A-mediated hydroxylation, deacetylation |
Deacetylation, hydrolysis to formyl derivatives |
|
Range of serum half-life (hr) |
2-5 |
32-67 |
14-18 |
|
Effect on CYP3A |
Pronounced |
Weak |
Moderate |
|
Auto-induction |
Yes |
Yes |
No (or slight) |
|
Effect on indinavir AUC (example of CYP3A induction) |
92% decrease |
34% decrease |
70% decrease |
|
Change in AUC when given with a CYP3A inhibitor |
No effect |
293% increase |
No effect |
|
Typical Cmax (mcg/ml) |
10.0 |
0.45 |
15.0 |
|
MIC in broth culture (mcg/ml) |
0.15 |
0.06 |
0.04 |
|
Binding to plasma proteins (%) |
85% |
71-85% |
97% |
Table 4. Comparison of Rifapentine trials in HIV-Negative TB
|
Feature |
Hong Kong |
HMR 008 |
TBTC Study 22 |
|
Induction regimen (initial 2 months of treatment) |
2 (HRZS)3 |
2 HRZE, or 2 (HZE)7P2 |
2 (HRZE/S)7, or ½ (HRZE/S)7 1½HRZE/S)2
|
|
No. doses |
72, 40, 35 |
88, 72 |
58-76, 42-60 |
|
Continuation regimen (after the first 2 months of treatment) |
4 (HR)3 4 (HP)1 4(HP)1:2/3 |
4 (HR)2 4 (HP)1 |
4 (HR)2 4 (HP)1 |
|
|
|
|
|
|
Life table rate of F/R in 4(HR)2 or 3 |
4.2% |
Estimated 8% |
5.9%
|
|
Life table rate of F/R in 4(HP)1 |
10.2% |
Estimated 14% |
10.3%
|
Table legend: E = ethambutol, H = isoniazid, P = rifapentine, R = rifampin,
S = streptomycin, Z = pyrazinamide. Number indicates how many months of treatment; subscript number indicates the number of doses per week.
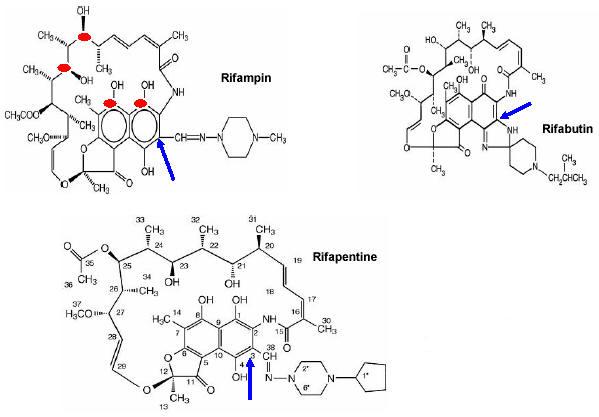
Figure 1. Structure of 3 Rifamycins
Figure 2. Hypothesized Populations of TB Bacilli relative to Drug Effects