Table 1. In vitro activity of caspofungin, micafungin and anidulafungin against Candida sp. (9, 22, 28, 29, 59, 63, 65, 75, 76, 97)
|
|
Caspofungin |
Micafungin |
Anidulafungin |
||||||
|
Species |
N |
MIC (Range) |
MIC90 |
n |
MIC (Range) |
MIC90 |
n |
MIC (Range) |
MIC90 |
|
Candida albicans |
3450 |
0.007->0.8 |
0.125-0.5 |
45 |
<0.0039-0.0625 |
0.0156-0.0625 |
42 |
<0.001-0.015 |
0.0078 |
|
Candida glabrata |
756 |
0.007->0.8 |
0.25-1 |
39 |
0.0078-0.0625 |
0.0156-0.0039 |
13 |
0.0039-0.03 |
0.03 |
|
Candida krusei |
185 |
0.125-2 |
1 |
19 |
0.125-0.25 |
0.125-0.25 |
11 |
0.0078-0.015 |
0.015 |
|
Candida parapsilosis |
635 |
0.03->16 |
1-4 |
29 |
0.5-2 |
1 |
12 |
0.125-16 |
1 |
|
Candida tropicalis |
127 |
0.03-2 |
0.125-1 |
13 |
0.0156-0.125 |
0.0313-0.125 |
10 |
0.002-0.015 |
0.0015 |
|
Candida lusitaniae |
35 |
0.12-2 |
1-2 |
|
|
|
3 |
0.0015 |
0.0015 |
MIC = minimum inhibitory concentration (µg/ml); MIC90, = MIC required to inhibit 90% of organisms compared to growth control.
MICs were determined by broth microdilution with RPMI-1640 medium after incubation for 48 hours.
Table 2. In vitro activity of caspofungin, micafungin and anidulafungin against Aspergillus sp. (8, 30, 31, 70, 83, 90, 97)
|
|
Caspofungin |
Micafungin |
Anidulafungin |
||||||
|
Species |
n |
MIC90 |
n |
MEC (Range) |
n |
MIC (Range) |
MIC90 |
n |
MIC90 |
|
Aspergillus flavus |
97 |
0.12->32 |
58 |
<0.03-2 |
14 |
0.0078-0.0156 |
0.0156 |
9 |
<0.03 |
|
Aspergillus fumigatus |
274 |
0.25->32 |
191 |
<0.03->8 |
47 |
0.0078-0.0156 |
0.0078-0.0156 |
28 |
<0.03 |
|
Aspergillus niger |
30 |
0.25-1 |
39 |
<0.03-1 |
16 |
<0.0039-0.0156 |
0.0078 |
9 |
<0.03 |
|
Aspergillus terreus |
36 |
0.2-0.6 |
26 |
<0.03-0.5 |
8 |
<0.0039-0.0078 |
0.0078 |
2 |
<0.03 |
MIC = minimum inhibitory concentration (µg/ml); MIC90, = MIC required to inhibit 90% of organisms compared to growth controls.
MEC = minimal effective concentration
MICs were determined by broth microdilution with RPMI-1640 medium after incubation for 48 hours.
Table 3. Pharmacokinetic parameters of caspofungin, micafungin and anidulafungin (16, 27, 34, 48, 79, 95, 96, 102, 103, 105)
|
|
Caspofungin |
Micafungin |
Anidulafungin |
|
Plasma elimination half-life |
9-11 h |
11.6-15.2 h |
29 h 30 h* |
|
Volume of distribution |
9.67L |
14L |
41.2L |
|
Plasma protein binding |
Extensive (97%) |
Extensive (99%) |
84% |
|
Metabolism |
Hepatic (primarily hydrolysis to inactive metabolites) |
Hepatic |
Hepatic |
|
Clearance |
12 mL/min |
13 mL/min |
16 mL/min |
* After oral dosing
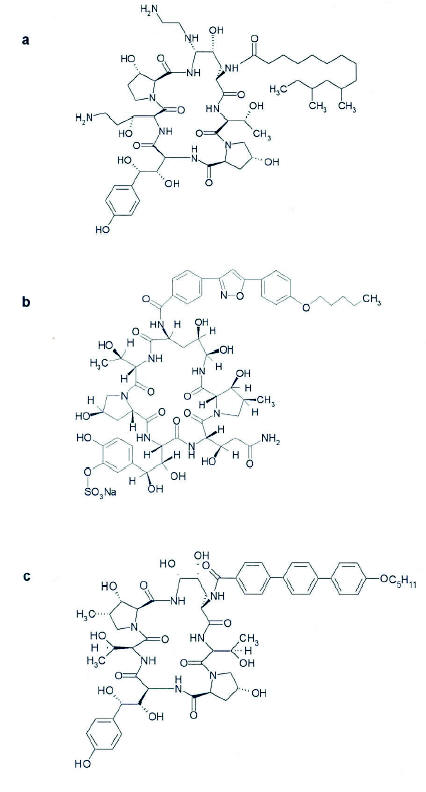
Figure 1. Structure of (a) Caspofungin, (b) Micafungin, and (c) Anidulafungin.
Figure 2. Effects of in vitro echinocandin exposure to (a) Candida species, (b) Aspergillus species. While the drugs typically kill Candida species, potentially resulting in fungicidal’ effects, activity against Aspergillus species is only appreciated in growing cells located at branch points and tips of filaments. This latter effect causes ballooning, blunting, and other forms of aberrant growth upon microscopic evaluation (b).