Table 1. In vitro activity of ketolides and comparator macrolides against aerobic gram-positive bacteria
|
Organism |
Ketolide |
|
|
|
|
Macrolide |
|
|
|
|
||
|
|
Telithromycin |
Cethromycin |
|
Azithromycin |
Clarithromycin |
|||||||
|
|
MIC50 |
MIC90 |
Range |
MIC50 |
MIC90 |
Range |
MIC50 |
MIC90 |
Range |
MIC50 |
MIC90 |
Range |
|
|
|
|
|
|
|
|
|
|
|
|
|
|
|
Streptococcus pneumoniae |
0.015 |
0.06 |
£0.001 - ³64 |
0.004 |
0.03 |
£0.001 - ³64 |
0.12 |
³64 |
0.008 - ³64 |
0.03 |
³64 |
0.001 - ³64 |
|
Erythromycin Susceptible |
0.008 |
0.016 |
£0.001 - 0.12 |
0.004 |
0.004 |
£0.001 - 0.06 |
0.06 |
0.25 |
0.008 - 64 |
0.03 |
0.06 |
0.001 - 1 |
|
ErmB Resistance |
0.06 |
0.12 |
£0.001 - ³64 |
0.004 |
0.06 |
0.002 - ³64 |
³64 |
³64 |
1 - ³64 |
³64 |
³64 |
0.25 - ³64 |
|
MefA Resistance |
0.06 |
0.5 |
0.002 - 2 |
0.004 |
0.12 |
£0.002 - 1 |
4 |
16 |
0.5 - 64 |
1 |
4 |
0.06 - ³64 |
|
|
||||||||||||
|
Streptococcus pyogenes |
0.015 |
0.015 |
0.002 - ³64 |
0.008 |
0.008 |
£0.002 - 32 |
0.12 |
0.25 |
0.001 - ³64 |
0.03 |
0.06 |
0.001 - ³64 |
|
Erythromycin Susceptible |
0.015 |
0.015 |
0.002 - 0.25 |
0.008 |
0.008 |
£0.002 - 0.008 |
0.12 |
0.25 |
0.001 - 0.5 |
0.015 |
0.015 |
0.001 - 0.06 |
|
ErmA Resistance |
0.06 |
0.12 |
0.008 - 0.25 |
0.03 |
0.06 |
£0.015 - ³1 |
32 |
³64 |
0.5 - ³64 |
8 |
8 |
0.25 - ³64 |
|
ErmB Resistance |
2 |
16 |
0.12 - ³64 |
0.12 |
2 |
£0.002 - 32 |
³64 |
³64 |
0.5 - ³64 |
³64 |
³64 |
0.25 - ³64 |
|
MefA Resistance |
0.5 |
0.5 |
0.004 - 2 |
0.12 |
0.12 |
£0.002 - 0.5 |
8 |
16 |
1 - 32 |
2 |
8 |
0.06 - 8 |
|
|
||||||||||||
|
Streptococcus agalactiae |
0.015 |
0.06 |
0.004 - 2 |
0.008 |
0.03 |
0.008 - 0.12 |
0.06 |
0.12 |
0.008 - ³32 |
0.03 |
0.06 |
0.008 - ³32 |
|
Viridans group Streptococci |
0.06 |
0.12 |
0.002 - 2 |
0.008 |
0.06 |
£0.008 - 1 |
2 |
8 |
0.008 - ³64 |
0.5 |
8 |
0.001 - ³64 |
|
|
||||||||||||
|
Staphlococcus aureus |
0.06 |
0.12 |
0.008 - ³64 |
0.03 |
0.03 |
£0.008 - ³64 |
2 |
³64 |
0.25 - ³64 |
0.25 |
³64 |
0.06 - ³64 |
|
Erythromycin Susceptible |
0.06 |
0.06 |
0.008 - 0.5 |
0.03 |
0.03 |
0.008 - 0.25 |
2 |
2 |
0.25 - ³16 |
0.25 |
0.25 |
0.06 - 0.5 |
|
Erythromycin Resistant |
2 |
³64 |
0.03 - ³64 |
³64 |
³64 |
£0.008 - ³64 |
32 |
³64 |
0.5 - ³64 |
³64 |
³64 |
1 - ³64 |
|
CNS |
0.06 |
32 |
0.03 - ³64 |
0.03 |
8 |
£0.015 - ³64 |
1 |
16 |
0.06 - ³64 |
0.25 |
³64 |
0.03 - ³64 |
|
|
||||||||||||
|
Enterococcus species |
0.06 |
4 |
0.004 - ³64 |
0.03 |
8 |
0.004 - ³64 |
16 |
³64 |
0.06 - ³64 |
2 |
³64 |
0.03 - ³64 |
|
Enterococcus faecalis |
0.06 |
4 |
0.004 - ³16 |
0.03 |
8 |
0.004 - ³64 |
16 |
³64 |
0.03 - ³64 |
2 |
³64 |
0.03 - ³64 |
|
Enterococcus faecium |
8 |
8 |
0.015 - ³16 |
1 |
8 |
0.008 - ³64 |
16 |
16 |
2 - ³64 |
³64 |
³64 |
0.06 - ³64 |
|
Corynebacterium species |
0.004 |
0.008 |
0.002 - ³64 |
0.008 |
0.008 |
0.002 - 0.5 |
³64 |
³64 |
£0.015 - ³64 |
0.008 |
0.008 |
0.004 - ³64 |
|
Listeria monocytogenes |
0.06 |
0.06 |
0.03 - 0.06 |
0.03 |
0.03 |
0.03 - 0.06 |
1 |
1 |
0.5 - 2 |
0.12 |
0.12 |
0.06 - 0.25 |
Macrolide resistance genotypes named according to the proposal set forth by Roberts et al. (161)
MIC50 = minimum inhibitory concentration of 50% of isolates, MIC90 = minimum inhibitory concentration of 90% of isolates, n.d. = data not available, CNS = Coagulase negative Staphylococci
Adapted from References:
Telithromycin: (5, 7, 13-15, 20, 28, 47, 50, 54, 61, 67, 70, 77, 80, 90, 94-98, 102, 112, 113, 116, 118, 121, 123-125, 127, 129, 130, 133-135, 137, 144, 147, 160, 167, 169, 172, 173, 177, 183, 192, 193); Cethromycin: (7, 12, 31, 47, 49, 58, 74, 82, 83, 95, 101, 139, 157, 172-174, 176, 190, 192, 199); Clarithromycin: (7, 20, 28, 31, 47, 49, 54, 61, 67, 70, 74, 80, 82, 90, 94, 96-98, 101, 121, 123-125, 127, 133-135, 139, 144, 147, 157, 160, 167, 177, 183, 192, 193, 198) ; Azithromycin: (12, 15, 20, 31, 47, 49, 54, 61, 67, 70, 74, 80, 82, 94, 96-98, 101, 102, 116, 121, 123-125, 127, 133-135, 139, 144, 147, 157, 160, 167, 177, 183, 192, 193, 198, 199)
Table 2. In vitro activity of ketolides and comparator macrolides against aerobic gram-negative bacteria
|
Organism |
Ketolide |
|
|
|
|
Macrolide |
|
|
|
|
||
|
|
Telithromycin |
Cethromycin |
|
Azithromycin |
Clarithromycin |
|||||||
|
|
MIC50 |
MIC90 |
Range |
MIC50 |
MIC90 |
Range |
MIC50 |
MIC90 |
Range |
MIC50 |
MIC90 |
Range |
|
|
|
|
|
|
|
|
|
|
|
|
|
|
|
Haemophilus influenzae |
1 |
2 |
0.002 - 16 |
2 |
4 |
0.001 - 16 |
2 |
4 |
0.001 - ³64 |
8 |
16 |
0.008 - ³64 |
|
Moraxcella catarrhalis |
0.06 |
0.12 |
0.001 - 4 |
0.06 |
0.06 |
£0.002 - 0.5 |
0.06 |
0.12 |
0.008 - ³64 |
0.12 |
0.12 |
0.008 - ³64 |
|
Neisseria species |
0.12 |
0.12 |
0.001 - 4 |
0.015 |
0.25 |
0.001 - 0.5 |
0.12 |
0.25 |
£0.015 - 8 |
0.25 |
1 |
0.001 - 8 |
|
Neisseria gonorrhoeae |
0.06 |
0.12 |
0.002 - 1 |
0.015 |
0.25 |
0.001 - 0.5 |
0.12 |
0.25 |
0.015 - 0.5 |
0.25 |
1 |
0.001 - 2 |
|
Neisseria meningitidis |
0.015 |
0.12 |
0.002 - 0.5 |
0.015 |
0.12 |
0.004 - 0.12 |
0.5 |
1 |
0.25 - 2 |
0.12 |
0.5 |
0.004 - 1 |
|
Bordetella pertussis |
0.015 |
0.03 |
0.004 - 0.06 |
n.d |
n.d |
n.d. |
0.03 |
0.06 |
0.008 - 0.06 |
0.06 |
0.06 |
0.015 - 0.12 |
|
Helicobacter pylori (Ery S) |
n.d |
0.5 |
n.d. |
0.12 |
0.25 |
0.008 - 0.25 |
0.25 |
0.5 |
0.06 - 0.5 |
0.015 |
0.03 |
£0.004 - 0.03 |
|
Helicobacter pylori (Ery R) |
n.d |
³64 |
n.d. |
32 |
³64 |
4 - 64 |
³64 |
³64 |
³64 |
n.d. |
n.d. |
n.d. |
MIC50 = minimum inhibitory concentration of 50% of isolates, MIC90 = minimum inhibitory concentration of 90% of isolates, n.d. = data not available
Adapted from References:
Telithromycin: (7, 14, 24, 28, 61, 96, 97, 99, 102, 112, 146, 152, 165, 193); Cethromycin: (7, 12, 31, 45, 58, 74, 82, 83, 139, 149, 157);
Clarithromycin: (7, 14, 24, 28, 31, 45, 61, 74, 82, 94, 97, 99, 139, 146, 149, 152, 157, 165, 193, 198); Azithromycin: (12, 14, 24, 31, 45, 61, 74, 82, 94, 97, 99, 139, 146, 152, 157, 165, 193, 198)
Table 3. In vitro activity of ketolides and comparator macrolides against anaerobic bacteria
|
Organism |
Ketolide |
|
|
|
|
Macrolide |
|
|
|
|
||
|
|
Telithromycin |
Cethromycin |
|
Azithromycin |
Clarithromycin |
|||||||
|
|
MIC50 |
MIC90 |
Range |
MIC50 |
MIC90 |
Range |
MIC50 |
MIC90 |
Range |
MIC50 |
MIC90 |
Range |
|
|
|
|
|
|
|
|
|
|
|
|
|
|
|
Bacteroides species |
8 |
³64 |
0.015 - ³64 |
4 |
4 |
0.001 - ³64 |
8 |
³64 |
0.06 - ³64 |
4 |
³64 |
0.06 - ³64 |
|
Bacteroides fragilis |
16 |
16 |
0.06 - ³64 |
2 |
4 |
0.06 - ³64 |
8 |
³64 |
0.25 - ³64 |
2 |
³64 |
0.06 - ³64 |
|
Clostridium species |
0.12 |
³64 |
0.004 - ³64 |
0.03 |
³64 |
0.004 - ³64 |
2 |
³64 |
0.12 - ³64 |
0.5 |
³64 |
0.06 - ³64 |
|
Clostridium perfringens |
0.12 |
0.25 |
0.004 - 0.25 |
0.03 |
0.03 |
0.03 - ³64 |
0.5 |
1 |
0.25 - 4 |
0.5 |
1 |
0.12 - 1 |
|
Clostridium difficile |
0.25 |
³64 |
0.03 - ³64 |
0.25 |
³64 |
0.03 - ³64 |
8 |
³64 |
0.5 - ³64 |
0.5 |
³64 |
0.12 - ³64 |
|
Fusobacterium species |
³64 |
³64 |
0.008 - ³64 |
0.5 |
³64 |
0.008 - ³64 |
8 |
³64 |
£0.015 - ³64 |
³64 |
³64 |
£0.015 - ³64 |
|
Peptostreptococcus species |
0.06 |
0.06 |
0.002 - ³64 |
0.03 |
0.03 |
0.004 - ³32 |
4 |
³64 |
0.015 - ³64 |
0.06 |
³64 |
£0.008 - ³64 |
MIC50 = minimum inhibitory concentration of 50% of isolates, MIC90 = minimum inhibitory concentration of 90% of isolates, n.d. = data not available
Adapted from References:
Telithromycin: (2, 7, 28, 41, 66, 80, 81, 125, 191); Cethromycin: (7, 41, 72, 82, 83, 139, 175); Clarithromycin: (7, 28, 41, 80-82, 125, 139, 175, 198); Azithromycin: (41, 80-82, 125, 139, 175, 198)
Table 4. Pharmacokinetic properties of telithromycin and cethromycin
|
Drug |
Dosage (mg) |
% F
|
Cmax (mg/mL) |
Tmax (h) |
AUC (mg*h/L) |
T ½ (h) |
Vd/F (L) |
% Protein Binding |
% Excreted Unchanged |
Dose Adjustment a
|
Effect of Food on Absorption b |
References |
|
|
|
|
|
|
|
|
|
|
|
|
Renal |
Hepatic |
|
|
|
Telithromycin |
800 |
60 |
1.90 |
1.0 |
9.0 |
7.2 |
n.d. |
70% |
12.7 |
Yes |
No |
« |
|
|
Cethromycin
|
100 200 400 600 800 1200 |
n.d. |
0.14 0.18 0.61 1.19 0.99 1.17 |
0.9 1.5 2.3 2.7 3.9 5.1 |
0.63 0.87 3.84 6.83 9.55 10.96 |
3.6 5.3 6.7 5.6 6.7 6.6 |
940 1975 1366 1674 1255 1300 |
n.d. |
n.d. |
n.d. |
n.d. |
« |
|
|
|
150 |
n.d. |
0.32 |
1.8 |
1.66 |
5.66 |
n.d |
n.d. |
n.d |
n.d |
n.d |
n.d |
(153) |
n.d. = no data
F = bioavailability; Cmax = peak concentration reached in the plasma; Tmax = time to reach Cmax; AUC = area under the concentration time curve; T ½ = half life; Vd = volume of distribution
a: dosage adjustment refers to whether or not the ketolide requires any dosage adjustment in patients with impaired renal or hepatic function
b: effect of food on absorption refers to whether food increases (), decreases (¯) or does not affect («) absorption
Table 5. Tissue distribution of telithromycin
|
|
Tissue/Plasma or Fluid/Serum Ratio |
References |
|||||||||
|
Site |
Bronchial Mucosa a |
Epithelial Lining Fluid a |
Saliva c |
Sputum e |
Middle Ear Fluid d |
Tonsils d |
Sinus Fluid d |
WBC a |
Alveolar Macrophages a |
PMNLs b |
|
|
Telithromycin |
12.1 |
16.8 |
1.6 |
4.8 |
2.4 |
7.8 |
4.0 |
³500 |
³500 |
135 - 613 |
|
PMNL = polymorphonuclear leukocyte
a: data reported as the ratio of tissue or fluid concentration over plasma concentration 24 hours after last dose.
b: results reported from in vitro experiments and show variation depending upon source of the PMNs, extracellular antibiotic concentration and time point of sample
c: results reported as a ratio of AUCsaliva/AUCplasma.
d: results reported as a ratio of tissue or fluid concentration over plasma concentration 6 hours after a single dose
e: results reported as a ratio of maximum sputum concentration/maximum plasma concentration after telithromycin 600 mg once daily for 7 days
Table 6. Adverse Effects Reported for Telithromycin [Adapted from (108, 171)]
|
Adverse effects |
Telithromycin |
|
Gastrointestinal |
|
|
Abdominal pain |
+ |
|
Nausea |
++ |
|
Vomiting |
+ |
|
Diarrhea |
+++ |
|
Blurred vision |
+ |
|
Allergic reactions |
+/- |
|
Hepatic function abnormality |
+ |
|
Ototoxicity |
- |
|
Taste perversion |
+ |
|
Cardiovascular events |
+/- |
|
Central nervous system |
|
|
Headache |
+ |
|
Dizziness |
+ |
- indicates adverse effect has not been observed; +/- indicates adverse effect occurs in <1% of patients; + indicates that adverse effect occurs in 1 – 5% of patients; ++ indicates that adverse effect occurs in 5 – 10% of patients; +++ indicates adverse effect occurs in >10% of patients.
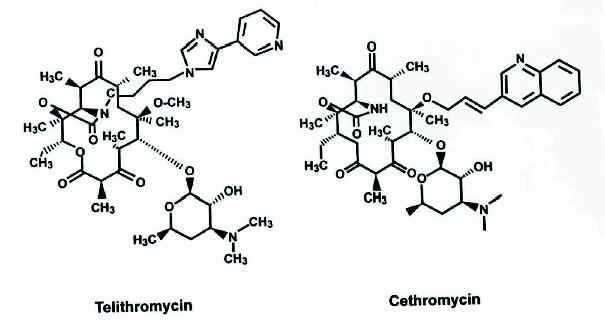
Figure 1. Chemical Structure of Telithromycin and Cethromycin.
Figure 2. Structure Activity Relationship of the Ketolide Antibiotics.
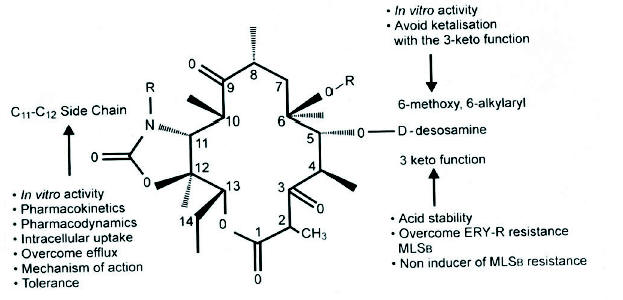
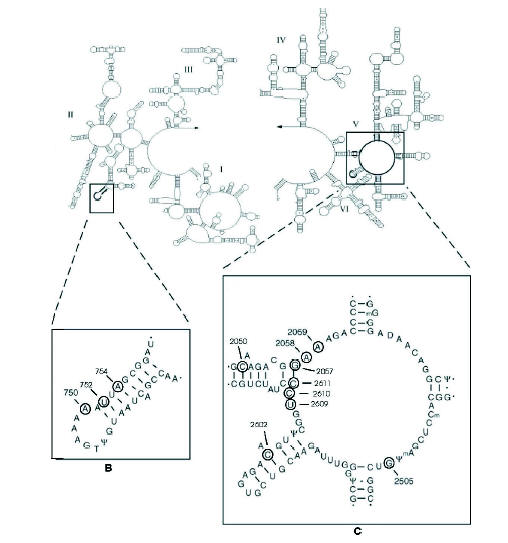
Figure 3. A: Schematic representation of the bacterial 23S rRNA secondary structure. Boxed are (B) hairpin 35 of domain II, and (C) the central loop of domain V of the rRNA. The encircled nucleotides A752, A2058, A2059 and G2505 (E. coli numbering) constitute the binding site for macrolide and ketolide antibiotics (92, 194)