Table 1. Pharmacokinetics of various
aminoglycosides [mean ± SD ] among different adult patient populations receiving
intravenous aminoglycoside therapy
|
Age in years Mean (Range) |
n |
Aminoglycoside |
t½ (hr) |
Vd (L/Kg) |
CLt (ml/min/kg) |
Reference |
Patient population |
|
(60-79) |
63 |
Gentamicin |
2.4 |
0.26 |
1.31 |
5 |
Febrile patients treated for gram-negative bacterial infection |
|
(20-39) |
51 |
Gentamicin |
2.2 |
0.23 |
1.29 |
5 |
|
|
(40-59) |
59 |
Gentamicin |
2.1 |
0.27 |
1.35 |
5 |
|
|
NA |
6 |
Gentamicin |
1.82 ± 0.51 |
0.248 ± 0.38 |
NA |
144 |
Obese patients > 30% excess weight |
|
NA |
7 |
Tobramycin |
1.80 ± 0.23 |
0.297 ± 0.64 |
NA |
144 |
|
|
38 (16-92) |
44 |
Gentamicin and Tobramycin |
NA |
0.41 ± 0.12A |
123 ± 46B |
151 |
Trauma patients |
|
29 (18-60) |
10 |
Amikacin |
1.40 ± 0.41 |
0.21 ± 0.08 |
78.6 ± 12.1B |
124 |
Patients with normal kidney function |
A Ideal body weight used
B ml/min/1.73m2
NA = Not available
Table 2. Pharmacokinetics of various aminoglycosides [mean ± SD ] among different pediatric patient populations receiving intravenous aminoglycoside therapy
|
Age Mean (Range) |
n |
Aminoglycoside |
Ke (hr-1) |
t½ (hr) |
Vd (L/kg) |
CL (ml/min/kg) |
Reference |
Patient Population |
|
(9months to 15 years) |
33 |
Gentamicin and Tobramycin |
NA |
2.32 ± 0.65 |
0.32 ±0.07 |
1.71 ± 0.53 |
74 |
Bone marrow transplant patients |
|
45 months |
26A |
Gentamicin |
0.3192 ± 0.1511 |
NA |
0.5186 ± 0.1445 |
NA |
154 |
Suspected or confirmed bacterial infection |
|
43 months |
26B |
Gentamicin |
0.2997 ± 0.1064 |
NA |
0.4939 ± 0.1136 |
NA |
154 |
|
|
(10-14 years) |
7A |
Tobramycin |
NA |
2.37 ± 0.37 |
0.43 ± 0.09 |
3.67 ± 0.82C |
84 |
Cystic fibrosis patients |
|
(0.5- 4 years) |
8 |
Gentamicin |
0.31 ± 0.01 |
NA |
0.43 ± 0.03 |
NA |
4 |
|
|
(5-10 years) |
11 |
Gentamicin |
0.37 ± 0.01 |
NA |
0.35 ± 0.01 |
NA |
4 |
|
|
11-18 years) |
12 |
Gentamicin |
0.37 ± 0.01 |
NA |
0.32 ± 0.01 |
NA |
4 |
|
A Once-daily administration
B Multiple-daily administration
C L/hr
NA = Not Available
|
Table 3. Therapeutic range and dosage for patients with normal renal function receiving conventional aminoglycoside multiple-dose regimens. |
|||
|
|
Therapeutic |
Range (mg/ml) |
|
|
Aminoglycoside |
Peak |
Trough |
Dosage for Normal Renal Function |
|
Gentamicin |
6 - 10 |
< 2 |
1.7 - 2 mg/kg every 8 hours |
|
Tobramycin |
6 - 10 |
< 2 |
1.7 - 2 mg/kg every 8 hours |
|
Netilmicin |
6 - 10 |
< 2 |
1.7 - 2 mg/kg every 8 hours |
|
Amikacin |
15 - 35 |
< 5 |
5 mg/kg every 8 hours or 7.5 mg/kg every 12 hours |
|
Streptomycin |
15 - 30 |
< 5 |
Generally 1.0 g every 24 hours (range, 0.5 -2.0 g) |
|
Table 4. Selection of aminoglycoside maintenance dosing using the method of Sarubbi and Hull (1978). |
||||
|
Creatinine Clearance (ml/minute) |
Half-life (hrs) |
8 hr Dose Interval |
12 hr Dose Interval |
24 hr Dose Interval |
|
90 |
3.1 |
84% |
- |
- |
|
80 |
3.4 |
80 |
91% |
- |
|
70 |
3.9 |
76 |
88 |
- |
|
60 |
4.5 |
71 |
84 |
- |
|
50 |
5.3 |
65 |
79 |
- |
|
40 |
6.5 |
57 |
72 |
92% |
|
30 |
8.4 |
48 |
63 |
86 |
|
25 |
9.9 |
43 |
57 |
81 |
|
20 |
11.9 |
37 |
50 |
75 |
|
17 |
13.6 |
33 |
46 |
70 |
|
15 |
15.1 |
31 |
42 |
67 |
|
12 |
17.9 |
27 |
37 |
61 |
|
10 |
20.4 |
24 |
34 |
56 |
|
7 |
25.9 |
19 |
28 |
47 |
|
5 |
31.5 |
16 |
23 |
41 |
|
2 |
46.8 |
11 |
16 |
30 |
|
0 |
69.3 |
8 |
11 |
21 |
|
Table 5. Suggested once daily dosage requirements for patients with altered renal function. |
|||
|
Aminoglycoside |
Creatinine Clearance (ml/minute) |
Dosage Interval (hr) |
Dose (mg/kg) |
|
Gentamicin/Tobramycin |
> 80 |
24 |
5.0 |
|
|
70 |
24 |
4.0 |
|
|
60 |
24 |
4.0 |
|
|
50 |
24 |
3.5 |
|
|
40 |
24 |
2.5 |
|
|
30 |
24 |
2.5 |
|
|
20 |
48 |
4.0 |
|
|
10 |
48 |
3.0 |
|
|
Hemodialysis* |
48 |
2.0 |
|
|
|
|
|
|
Amikacin |
> 80 |
24 |
15 |
|
|
70 |
24 |
12 |
|
|
50 |
24 |
7.5 |
|
|
30 |
24 |
4.0 |
|
|
20 |
48 |
7.5 |
|
|
10 |
48 |
4.0 |
|
|
Hemodialysis* |
48 |
5.0 |
|
Adapted from Gilbert DN, Bennett WM. Use of antimicrobial agents in renal failure. Infect Dis Clin North Am 1989;3:517-531. and Bennett (1989). *Administer post-hemodialysis |
|||
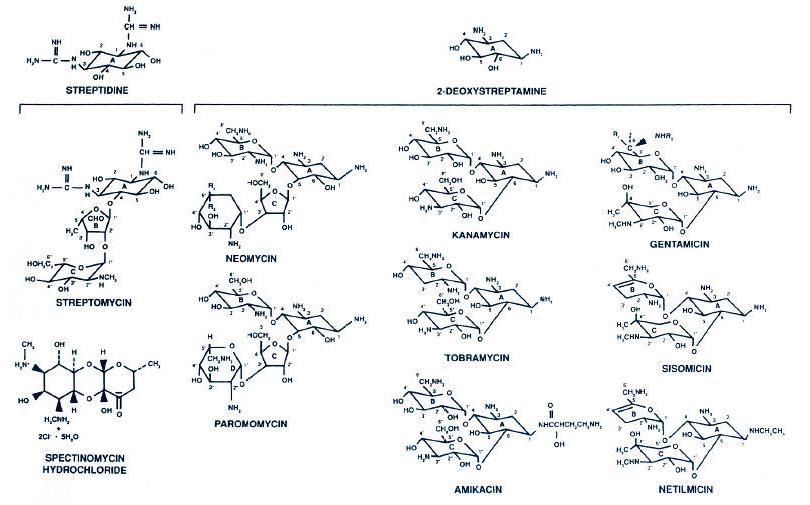
Figure 1.
Chemical structure of the aminoglycosides and spectinomycin. Neomycin contains
approximately equal amounts of neomycin B (R1 = H; R2 = CH2NH2)
and neomycin C (R1 = CH2NH2; R2 = H). Kanamycin is
principally kanamycin A, as shown. Gentamicin is gentamicin C complex with
roughly equal amounts of C1 (R1 = R2 = CH3), C1a (R1 = R2 = H), and
C2 (R1 = CH3; R2 = H). (Modified with permission from Gilbert DN. Aminoglycosides. In: Mandell GL, Bennett JE, Dolin R, eds. Principles and
practice of infectious diseases. New York: Churchill Livingstone, 1995:281.)
Figure 2. Structures of amikacin (i), gentamicin C1a (ii), and kanamycin B (iii). Arrows indicate sites of modification by resistance enzymes. Tobramycin is 3'-deoxykanamycin B.

Figure 3. Influence of drug concentration on the bactericidal activity of tobramycin, ciprofloxacin and ticarcillin. (Reprinted from permission from Craig WA, Ebert SC. Killing and regrowth of bacteria in vitro: a review. Scand J Infect Dis 1991; 74(Suppl):63-70. With permission.)
Figure 4. Antimicrobial pharmacodynamics: an integration of microbiologic
activity and pharmacokinetics.
Figure 5. Simulated concentration versus time profile for once-daily (7 mg/kg
q. 24 h) and conventional (1.5 mg/kg q. 8 h) regimens in patients with normal
renal function.
Figure 6. Once-daily aminoglycoside nomogram for the assessment of dosing interval using a
7 mg/kg dose of gentamicin or tobramycin. (Reprinted from Nicolau DP, Freeman CD, Belliveau PP, Nightingale CH, Ross JW, Quintiliani R. Experience with a once-daily aminoglycoside program administered to 2,184 adult patients. Antimicrob Agents Chemother 1995;39:650-655. With permission).